 As a web developer, you definately find times when you found a cool webpage and wonder how they did it. You wonder if there’s a tool that can show you in real-time what is happening or let you access the properties, attributes, HTML, CSS, DOM, JS of a page. Bear in mind that I’m not talking about what happens in the backend like server-side scripting language (Perl, PHP, ASP, CFM and JSP) and database access but more into the looks and user interaction (which i would refer to as the frontend).
Most of the time, you usually can’t get access to scripting language and database access (unless you are the developer) as they are meant to be run on the server and for security reasons, these code shouldn’t be accessible by public. They are things that does the real work, business logics, data warehousing etc and are strictly for the backend.
But as for the frontend, they are all viewable and accessibe from the client side (which is your browser!). HTML, CSS, JS, *some* AJAX components and DOM are all viewable and you can already read the code from your browser if you wanted to. And since it can be hard to find what you are looking for when there are lots of code and different techniques involved, you need some tools to help you filter information and return those that you are interested in. With these tools, you can and you are in good chance to learn from them and improve your skills in web development.
Below are some fundamentals tools that I think each web developer should have and using it day in day out.
Mozilla Firefox
Firebug
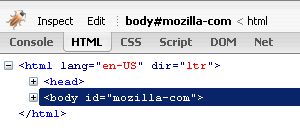
Firebug integrates with Firefox to put a wealth of development tools at your fingertips while you browse. You can inspect, edit, debug, and monitor CSS, HTML, and JavaScript live in any web page. Download Here
This is the number 1 tool in my book. The most notable feature is the debugger, as it allows you to set breakpoints on javascript (and thus AJAX as well) and allows you to debug them. Debugging is so important and it can help save a lot of time during testing and fixing your code.
Web Developer
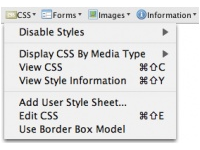
Adds a menu and a toolbar with various web developer tools like information about images, forms, cookies, page size, validation etc. Download here
If you’re just starting out, these 2 developer tools for firefox should help you get a lot of job done easier and faster.
Opera
I’m a heavy user of Opera. It’s the best browser ever invented, small in size and taking only a minimal memory footprint (unlike IE and firefox!), and simply the fastest among all (use it and believe me, you will never ever going to get that kind of speed in IE and firefox!)
And there’s a developer toolbar for Opera as well!
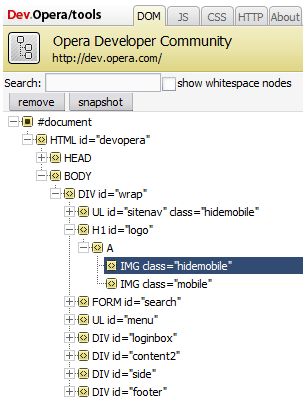
Opera Developer Console
Opera now includes a developer console that can be added into the browser with many new features. The developer console includes new tools including DOM inspector, JavaScript inspector, CSS editor and HTTP header inspector.
This tool kinda have the same functionality of firebug, but lacks one of the most important one – a debugger. Apart from that, everything is very usable. I find the DOM inspector very interactive as it highlights the DOM element in the DOM inspector when you click on an element (form, input, p, div etc) on the web page, and vice versa. You can thus pinpoint a specific DOM element and look through directy what properties it contains. Firebug is not that interactive yet to show you what DOM element was selected and its properties, although it has a “inspect” button which inspects other parts such as HTML and CSS perfectly.
DOM Snapshot
The DOM Snapshot tool allows you to inspect the source of a page, as parsed by the browser. Personally, I don’t find this very useful as I can already get this information from “View Source” directly.
Opera Dragonfly
Opera Dragonfly was introduced since Opera 9.5, and has since supersedes Opera Developer Console and DOM snapshot as the default developer tool in Opera. If you’re looking for something similar to Firebug in Firefox for Opera, Dragonfly will certainly amuse you.
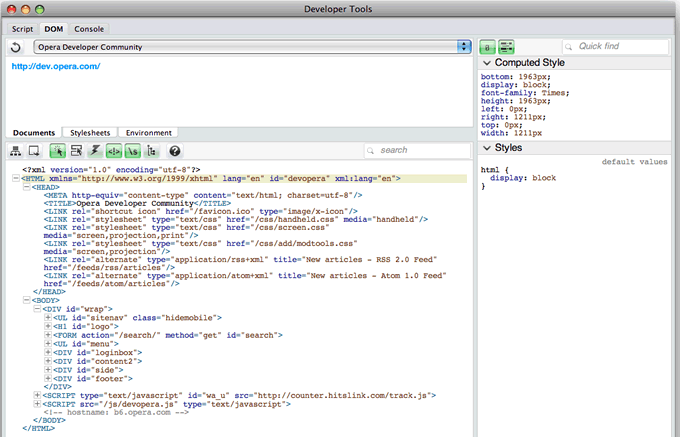
Opera Dragonfly features include:
– JavaScript debugger
– DOM inspector
– CSS inspector
– Command Line to allow commands to be inputed
– Error Console that outputs validation errors and warnings exhibited by the CSS and JavaScript connected with the page
– Proxy to allow debugging directly on mobile devices
Internet Explorer
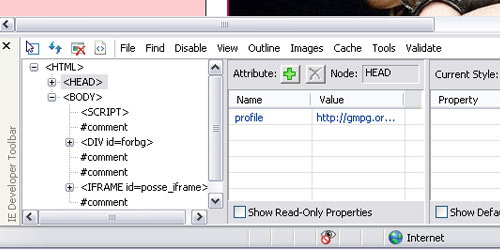
Last in the list is Internet Explorer because I seriously don’t use it. But if you are interested, there’s a IE web developer toolbar for download here. * The web developer tool comes preinstalled when you install IE8.
I know Internet Explorer has the largest market share and as a web developer, getting your site to be presentable and functioning in IE is a must.
Well, there’s a trick, I still prefer to do all my development in Firefox since I can get to use Firebug. And later on when I want to test to see how it goes on IE, I just use IE tab (a firefox addon, download it here) and switch it to view the page (with IE rendering machine) within a Firefox tab. When testing is done, I switch it back to Firefox again and continue working.
Note: Firebug won’t work anymore when you are viewing in IE tab
You can do the same thing in Opera as well by developing in Opera with Opera Developer Console, and test your pages with IE in a Opera tab using a Custom Button. Getting an IE tab custom button to work in Opera is a bit *more* tricky as it involves antoher plugin known as Neptune. Just open and test in Internet Explorer if it sounds like too much hassle.
Happy developing!
Leave a Reply